DB2 Version 9.7 for Linux, UNIX, and Windows

Interfaces for viewing XML monitor information as formatted text

You can view the data contained in the XML documents produced by monitor interfaces in several ways, depending on how you want to view or use the data. You can use XQuery to query and manipulate the XML documents returned by monitoring interfaces. You can also use table functions to format the XML documents for easier reading.

XQuery provides a powerful and flexible interface for querying and manipulating XML data. However, there are times where you might want to view element data in a text-based format. Depending on your needs, you can view monitor elements contained in an XML document in column- or row-oriented format. The former is useful if you know which monitor elements you want to see. The latter is useful if you do not know ahead of time which monitor elements you want to examine, such as when you want to see the top five types of wait times. The sections that follow describe two ways that you can view monitor data contained in XML documents as formatted text.

Viewing monitor elements in column-oriented format

The XMLTABLE table function takes an XML document as input and coverts it into a relational table such that each of the selected XML document elements appears as a column. This approach is useful if you know which monitor elements you want to display. For example, assume that you have created a statistics event monitor called DBSTATS to collect information from the event_scstats logical data group. (See event_scstats logical data group for more information about the monitor elements associated with this logical data group.) The monitor elements in this logical group include metrics, which is an XML document that itself contains the metrics that make up the system_metrics monitor element. (See system_metrics for more information about the monitor elements associated with the system_metrics monitor element.) To view specific system_metrics monitor elements contained in metrics, such as rows_returned, total_section_time, or total_cpu_time, you can use the XMLTABLE table function to format selected monitor elements from the metrics documents returned by the statistics event monitor. The example that follows illustrates this. (For presentation purposes, the SQL returns results only for a specific service class.)
SELECT partition_number, 
       service_class_id, 
       statistics_timestamp, 
       event.rows_returned, 
       event.total_section_time, 
       event.total_cpu_time
 FROM  SCMETRICS_DBSTATS as DBSTATS,
 XMLTABLE( XMLNAMESPACES( DEFAULT 'http://www.ibm.com/xmlns/prod/db2/mon' ),
           '$metrics/system_metrics' PASSING XMLPARSE( DOCUMENT DBSTATS.METRICS ) as "metrics"
           COLUMNS
           rows_returned         BIGINT      PATH 'rows_returned',
           total_section_time    BIGINT      PATH 'total_section_time',
           total_cpu_time        BIGINT      PATH 'total_cpu_time'
          ) AS EVENT 
 WHERE service_class_id = 12;

The following output shows the results for this query:

PARTITION_NUMBER SERVICE_CLASS_ID STATISTICS_TIMESTAMP       ROWS_RETURNED    TOTAL_SECTION_TIME TOTAL_CPU_TIME
---------------- ---------------- -------------------------- ---------------- ------------------ ----------------
               0               12 2010-01-05-12.14.37.001717              402                990          1531250
               0               12 2010-01-05-12.15.00.035409              402                990          1531250
               0               12 2010-01-05-12.20.00.021884              412               1064          1609375
               0               12 2010-01-05-12.25.00.039175              422               1075          1687500
               0               12 2010-01-05-12.29.59.950137              432               1104          1765625
               0               12 2010-01-05-12.34.59.948979              442               1130          1796875
               0               12 2010-01-05-12.39.59.903928              452               1149          1890625
               0               12 2010-01-05-12.44.59.953596              462               1178          1953125
               0               12 2010-01-05-12.49.59.970059              473               1207          2062500
               0               12 2010-01-05-12.54.59.971990              483               1230          2109375

  10 record(s) selected.
In this case, the first three columns are displayed directly from the table SCMETRICS_DBSTATS table produced by the statistics event monitor. The last three columns are metrics monitor elements extracted from the XML document in the METRICS column of the table.

For more information about using XMLTABLE, refer to the documentation for that function. You can also see examples of using XMLTABLE to view monitor elements in the documentation for the various MON_GET_*_DETAILS functions.

Viewing monitor elements in row-oriented format

The table functions with names of the form MON_FORMAT_XML_* _BY_ROW introduced in DB2® Version 9.7 Fix Pack 1 provide a quick way to display the metrics monitor elements contained in an XML document. They report metrics in a row-based format, with each monitor element appearing in a row by itself. The following functions are included in this group:
For example, the XML document returned by the statistics event monitor, DETAILS_XML, might look something like the one shown in the first part of Figure 1. If you use the MON_FORMAT_XML_WAIT_TIMES_BY_ROW function to format the content of DETAILS_XML, the output would look like the table at the bottom of the diagram.
Figure 1. An XML file containing monitoring data, processed by one of the MON_FORMAT_XML_* functions. This example shows the use of the MON_FORMAT_XML_WAIT_TIMES_BY_ROW function. Only wait times are returned; other metrics contained in the XML file, such as wlm_queue_assignments_total are excluded by this particular function.
Process chart showing how XML gets converted to row-oriented format.
METRIC_NAME                          TOTAL_TIME_VALUE     COUNT                PARENT_METRIC_NAME           
------------------------------------ -------------------- -------------------- -----------------------------
WLM_QUEUE_TIME_TOTAL                                    0                    0 TOTAL_WAIT_TIME              
FCM_TQ_RECV_WAIT_TIME                                   0                    0 FCM_RECV_WAIT_TIME           
FCM_MESSAGE_RECV_WAIT_TIME                              0                    0 FCM_RECV_WAIT_TIME           
FCM_TQ_SEND_WAIT_TIME                                   0                    0 FCM_SEND_WAIT_TIME           
FCM_MESSAGE_SEND_WAIT_TIME                              0                    0 FCM_SEND_WAIT_TIME           
AGENT_WAIT_TIME                                         0                    0 TOTAL_WAIT_TIME              
LOCK_WAIT_TIME                                          0                    0 TOTAL_WAIT_TIME              
DIRECT_READ_TIME                                        0                    0 TOTAL_WAIT_TIME              
DIRECT_WRITE_TIME                                       0                    0 TOTAL_WAIT_TIME              
LOG_BUFFER_WAIT_TIME                                    0                    0 TOTAL_WAIT_TIME              
LOG_DISK_WAIT_TIME                                      0                    0 TOTAL_WAIT_TIME              
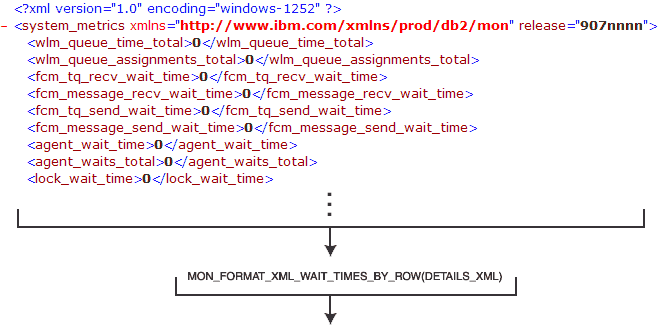
       ⋮
The number of columns returned varies by the specific function that you use. For example MON_FORMAT_XML_METRICS_BY_ROW returns two columns, one for the metric name, and one for its corresponding value:
METRIC_NAME               VALUE
------------------------- --------------------
WLM_QUEUE_TIME_TOTAL                         0
WLM_QUEUE_ASSIGNMENTS_TOT                    0
FCM_TQ_RECV_WAIT_TIME                        0
FCM_MESSAGE_RECV_WAIT_TIM                    0
FCM_TQ_SEND_WAIT_TIME                        0
         ⋮
By comparison, MON_FORMAT_XML_TIMES_BY_ROW returns four columns:
METRIC_NAME                    TOTAL_TIME_VALUE     COUNT      PARENT_METRIC_NAME     
------------------------------ -------------------- ---------- -----------------------
WLM_QUEUE_TIME_TOTAL                              0          0 TOTAL_WAIT_TIME        
FCM_TQ_RECV_WAIT_TIME                             0          0 FCM_RECV_WAIT_TIME     
FCM_MESSAGE_RECV_WAIT_TIME                        0          0 FCM_RECV_WAIT_TIME     
FCM_TQ_SEND_WAIT_TIME                             0          0 FCM_SEND_WAIT_TIME     
FCM_MESSAGE_SEND_WAIT_TIME                        0          0 FCM_SEND_WAIT_TIME     
          ⋮                                                                                              
The MON_FORMAT_XML_* _BY_ROW functions are useful when you do not know which elements you want to view. For example, you might want to see the top 10 wait-time monitor elements for the workload named CLPWORKLOAD. To collect this information, you can create a statistics event monitor called DBSTATS (event_wlstats logical data group). Assuming you set up this event monitor to write to a table, it records metrics in a column called DETAILS_XML. Once the output table from the event monitor is populated with monitor data, you can construct a query that uses the MON_FORMAT_XML_WAIT_TIMES_BY_ROW function to extract the monitor elements you want to see:
SELECT SUBSTR(STATS.WORKLOAD_NAME,1,15) AS WORKLOAD_NAME,
       SUBSTR(METRICS.METRIC_NAME,1,30) AS METRIC_NAME, 
       SUM(METRICS.TOTAL_TIME_VALUE) AS TOTAL_TIME_VALUE
FROM   WLSTATS_DBSTATS AS STATS, 
       TABLE(MON_FORMAT_XML_WAIT_TIMES_BY_ROW(STATS.DETAILS_XML)) AS METRICS 
WHERE  WORKLOAD_NAME='CLPWORKLOAD' AND (PARENT_METRIC_NAME='TOTAL_WAIT_TIME')
GROUP  BY WORKLOAD_NAME,METRIC_NAME 
ORDER  BY TOTAL_TIME_VALUE DESC
FETCH FIRST 10 ROWS ONLY
Remember: Time spent monitor elements are organized into hierarchies. In this example, to avoid double-counting wait times, only the monitor elements that roll-up to total_wait_time are included (see the WHERE clause in the preceding SQL statement). Otherwise, total_wait_time itself would be included in the results, which includes several individual wait times.
The output that follows shows what the results of the preceding query might look like:
WORKLOAD_NAME   METRIC_NAME                    TOTAL_TIME_VALUE
--------------- ------------------------------ --------------------
CLPWORKLOAD     LOCK_WAIT_TIME                             15138541
CLPWORKLOAD     DIRECT_READ_TIME                            6116231
CLPWORKLOAD     POOL_READ_TIME                              6079458
CLPWORKLOAD     DIRECT_WRITE_TIME                            452627
CLPWORKLOAD     POOL_WRITE_TIME                              386208
CLPWORKLOAD     IPC_SEND_WAIT_TIME                           283172
CLPWORKLOAD     LOG_DISK_WAIT_TIME                           103888
CLPWORKLOAD     DIAGLOG_WRITE_WAIT_TIME                       78198
CLPWORKLOAD     IPC_RECV_WAIT_TIME                            15612
CLPWORKLOAD     TCPIP_SEND_WAIT_TIME                           3291

  10 record(s) selected.
Note: The MON_FORMAT_XML_*_BY_ROW functions return only monitor elements that track measurements or metrics. These include monitor elements that track wait and component times, as well as counters. They do not return non-metrics monitor elements contained in the XML document, such as uow_id, or activity_id.

You can use the XMLTABLE function to view any of the elements (including non-metrics elements) contained in the XML document. However, the most frequently used, non-metrics monitor elements are returned as columns by the monitor functions that begin with MON_GET_*, such as MON_GET_UNIT_OF_WORK, or MON_GET_CONNECTION. If you are not familiar with XML, you might find it faster and easier to create queries using these functions than using the XMLTABLE function to extract monitor elements from an XML document.

To summarize: if you are interested in viewing non-metrics monitor elements, the MON_GET_* series of table functions might be a good alternative to the XMLTABLE function. If you are interested in viewing metrics monitor elements, the MON_FORMAT_XML_*_BY_ROW table functions might suit your needs.

1 Note: In these topics, when "metrics" or "details_xml" appears in lower-case letters, it refers to an XML document named metrics, or details_xml. METRICS, or DETAILS_XML, in upper-letters, refers to a column in a relational table called METRICS or DETAILS_XML that contains the metrics or details_xml documents.