Starting in DB2® Version
9.7, some monitor data is reported as elements in XML documents.
Using XML to report monitor information provides improved extensibility
and flexibility. New monitor elements can be added to the product
without having to add new columns to an output table. Also, XML documents
can be processed in a number of ways, depending on your needs. For
example:
- You can use XQuery to run queries against the XML document.
- You can use the XSLTRANSFORM scalar function to transform the
document into other formats.
- You can view their contents as formatted text using built-in MON_FORMAT_XML_*
formatting functions, or the XMLTABLE table function.
XML documents containing monitor elements are produced by several
monitoring interfaces. The sections that follow describe how results
are returned as XML documents.
Monitor table
functions with names that end with "_DETAILS"
Examples
of these table functions include:
- MON_GET_PKG_CACHE_STMT_DETAILS
- MON_GET_WORKLOAD_DETAILS
- MON_GET_CONNECTION_DETAILS
- MON_GET_SERVICE_SUBCLASS_DETAILS
- MON_GET_ACTIVITY_DETAILS
- MON_GET_UNIT_OF_WORK_DETAILS
These table functions return monitor elements
from the system and the activity monitoring perspectives. Most of
the monitor elements returned by these functions are contained in
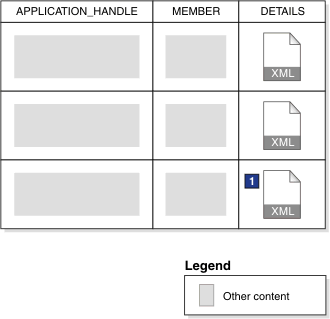
an XML document. For example, the MON_GET_CONNECTION_DETAILS table
function returns the following columns:
- APPLICATION_HANDLE
- MEMBER
- DETAILS
The DETAILS column of each row contains an XML document that
contains monitor element data. This XML document is composed of several
document elements that correspond to monitor elements.
Figure 1 illustrates the DETAILS column containing the XML documents. In
addition, it show monitor elements returned in the XML documents in
the DETAILS column.
Figure 1. Table returned by MON_GET_CONNECTION_DETAILS,
showing the DETAILS column containing XML documents.
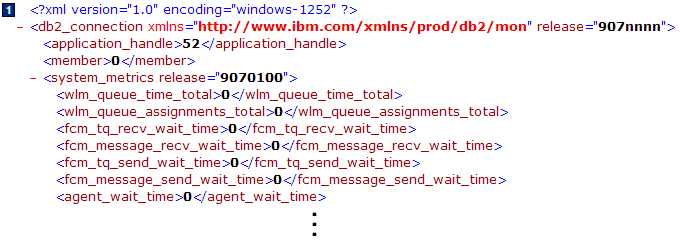
The
contents of the XML document in the third row ( 1 ) are shown following the table.
In the preceding example, the <agent_wait_time> XML document
element corresponds to
agent_wait_time monitor
element.
The schema for the XML document that is returned in
the DETAILS column is available in the file sqllib/misc/DB2MonRoutines.xsd. Further details can be found in the file sqllib/misc/DB2MonCommon.xsd.
Some of the monitor elements contained in the document in
the DETAILS column might be grouped into higher-level document elements.
For example, monitor elements that report on activity-related metrics
are part of the activity_metrics element. Similarly,
system-level metrics are part of the system_metrics element.
XML data returned by event monitors
Several event monitors
return data in XML format. They are summarized in
Table 1. Details
about the XML documents returned by the various event monitor are
described in the sections that follow.
Table 1. XML documents returned
by various event monitors| Event monitor |
Event monitor output format |
XML document returned |
|---|
| Statistics event monitor |
- Relational table
- File
- Named pipe
|
|
| Activity event monitor |
- Relational table
- File
- Named pipe
|
details_xml |
| Package cache event monitor |
Unformatted event (UE) table |
metrics This document can be viewed only after the UE table has been transformed
to either XML or relational tables.
|
| Unit of work event monitor |
Unformatted event (UE) table |
metrics This document can be viewed only after the UE table has been transformed
to either XML or relational tables.
|
Statistics event monitor
The statistics event monitor
records metrics in XML format when either of the twe following logical
data groups are included in the event monitor output:
- event_scstats
- event_wlstats.
When you create a statistics event monitor to report on monitor
elements in either of these groups, two XML documents are produced:
metrics and
details_xml. Both documents contain the same set of monitor elements that reflect
metrics information.
In the metrics document, the values
of the elements show the change in value for the monitor element since
the last time statistics were collected. The values of the elements
contained in details_xml are not reset
at each interval; they are reset only when the database is reactivated. If the data is written to a file or named pipe, these elements are
part of the self-describing data stream. If the event monitor data
is written to a table, the
metrics document
is stored in a column called METRICS;
details_xml is stored in a column called DETAILS_XML. (Note: In these topics,
when "metrics" or "details_xml" appears in lower-case letters, it
refers to an XML document named metrics, or details_xml. METRICS,
or DETAILS_XML, in upper-letters, refers to a column in a relational
table called METRICS or DETAILS_XML that contains the metrics or details_xml
documents.)
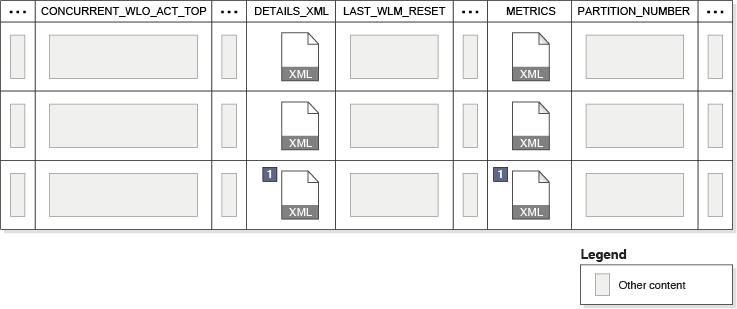
Figure 2 shows the XML documents in the METRICS and DETAILS_XML
columns as they appear in the SCSTATS table produced by the statistics
event monitor:
Figure 2. Output
of statistics event monitor (when written to a table), showing the
DETAILS_XML and METRICS columns. .
The contents of the
XML document in the third row ( 1 ) are
shown following the table.
Each of these the document contained in these columns contains
the
system_metrics monitor element, which, in
turn, contains a number of monitor elements that report on metrics
related to system.
Notes: - Starting with Version
9.7 Fix Pack 6, the XML document details_xml is deprecated in the
statistics event monitor, and might be removed in a future release.
For more information, see Reporting
of metrics in details_xml by the statistics event monitor has been
deprecated.
- The system_metrics element that is reported
in the details_xml document contained in the DETAILS_XML column produced
by the statistics event monitor is also a part of the XML document
contained in the DETAILS column returned by the MON_GET_SERVICE_SUBCLASS_DETAILS
and MON_GET_WORKLOAD_DETAILS table functions. Like the metrics reported
in the details_xml document, the values for the metrics reported in
the document contained in the DETAILS column accumulate until the
database is deactivated.
- See Information written to XML for system_metrics and activity_metrics monitor elements for the schema for the
XML output from a statistics event monitor.
Activity event
monitor
When you create an activity event monitor to report
on monitor elements in the event_activity logical data group (see
event_activity logical data group), one of the columns produced is DETAILS_XML. If the event
monitor is written to a table, DETAILS_XML is a column. If it is written
to a file or named pipe, DETAILS_XML is part of the self-describing
data stream. Either way, the document contains the
activity_metrics monitor element, which, in turn, contains a number of monitor elements
that report on metrics related to activities. See
Information written to XML for system_metrics and activity_metrics monitor elements for the schema for the XML output from
an activity event monitor.
Note: activity_metrics as reported in
the XML document in the DETAILS_XML column produced by the activity
event monitor is also a part of the XML document contained in the
DETAILS column returned by the MON_GET_ACTIVITY_DETAILS table function.
Package cache
event monitor
The package cache event monitor writes its output
to an unformatted event (UE) table. If you convert the data in this
table using the EVMON_FORMAT_UE_TO_TABLES table function, one of the
tables produced is PKGCACHE_EVENT. This table contains a METRICS column.
In each row, this column contains an XML document with elements associated
with package cache event monitor elements.
Note: Starting in
DB2 Version
9.7 Fix Pack 1, EVMON_FORMAT_UE_TO_TABLES also creates a separate
table for the metrics collected by this event monitor called PKGCACHE_METRICS.
This table contains the same information reported in the METRICS column
of the PKGCACHE_EVENT table. So, you can retrieve metrics from the
columns of the PKGCACHE_METRICS table, or you can use the use the
XML document contained in the METRICS column of the PKGCACHE_EVENT
table. See
Information written to relational tables for a package cache event monitor for details.
The EVMON_FORMAT_UE_TO_XML function also produces an XML document
with elements associated with package cache event monitor elements.
For example, the XML document element <num_executions> corresponds
to the num_executions monitor element. See Information written to XML for a package cache event monitor for the schema for the XML output from
a package cache event monitor.
Unit of work
event monitor
The unit of work event monitor writes its output
to an unformatted event (UE) table. If you convert the data in this
table using the EVMON_FORMAT_UE_TO_TABLES table function, one of the
tables produced is UOW_EVENT. This table contains a METRICS column,
which contains an XML document with elements associated with unit
of work event monitor elements.
Note: Starting in
DB2 Version
9.7 Fix Pack 1, EVMON_FORMAT_UE_TO_TABLES also creates a separate
table for the metrics collected by this event monitor called UOW_METRICS.
This table contains the same information reported in the METRICS column
of the UOW_EVENT table. So, you can retrieve metrics from the columns
of the UOW_METRICS table, or you can use the use the XML document
contained in the METRICS column of the UOW_EVENT table. See
Information written to relational tables for a unit of work event monitor for details.
The EVMON_FORMAT_UE_TO_XML
function also produces an XML document with elements associated with
unit of work event monitor elements. For example, the XML document
element <workload_name> corresponds to the workload_name monitor element. See Information written to XML for a unit of work event monitor for the
schema for the XML output from a unit of work event monitor.


