To check that a message flow or integration service is
processing messages as expected, you can send messages to the
flow by using the Flow Exerciser or
an external client. You can then use the Flow Exerciser to show the path that
each message took, and view the structure and content of the logical
message tree at any point in a message flow.
Before you begin
You must have the following components:
- A resource (integration service, stand-alone message
flow, application that includes a message flow, or REST API).
- An integration node and associated integration server that are
accessible from the IBM® Integration
Toolkit.
- If your message flow uses MQInput nodes to connect to
a remote queue manager, you must have either a WebSphere® MQ client or a WebSphere MQ server on the same machine as
the IBM Integration
Toolkit. To install WebSphere MQ components, see the WebSphere MQ product documentation: http://www.ibm.com/support/knowledgecenter/SSFKSJ_8.0.0/com.ibm.mq.ins.doc/q008250_.htm.
About this task
The Flow Exerciser is a tool that is available
from the flow editor and the integration service editor, but not from
the REST API Editor. If you want to use the Flow Exerciser with a REST API, you must
locate and open the main message flow of the REST API.
You can
use the
Flow Exerciser to perform the
following set of tasks:
- Deploy the resource to an integration server and set the message
flow to recording mode.
- Create and send an input message or previously
saved recorded message to the input node of the message
flow. For more information, see Messages
that you can use.
Note: You can also send messages
to the message flow by using an external client.
- Highlight the message path on the message flow and any subflows
that are associated with the message flow.
- Display the content of the logical message tree for a message
that passed through a connection in the message flow.
- Save the content of the logical message tree as a recorded message
that you can send to the message flow later.
The following videos show examples of how to use
the
Flow Exerciser:
Procedure
To check that a message flow or integration service is
processing messages as expected, complete the following steps:
- In the IBM Integration
Toolkit, perform
one of the following steps:
- If the message flow is a stand-alone message flow or a message
flow that is part of an application, open the flow with
the flow editor.
- If the message flow is part of an integration service, open the
integration service description with the service editor.
- If the message flow is part of a REST API, use the
message flow editor to open the main message flow of the REST API,
which is located under Resources.
- In the editor, click the Start Flow Exerciser icon
(
 ) in the Flow Exerciser toolbar.
 If you
have access to more than one integration server from the
IBM Integration
Toolkit, you are prompted to select
the integration server where you want to deploy the resource.
Note: If
the message flow receives messages on an MQInput node that is configured
to use a local queue manager, you can use the Flow Exerciser to send messages to that MQInput node only if you deploy
the flow to a local integration node.
The
resource is deployed to the integration server, and the message flow
is set to recording mode. The message flow in the message flow editor
is now in read-only mode.
- Send messages to the message flow by using one of the following
options:
- Use an external tool or client to form and send one or more input
messages to the flow. After the input messages are processed by the
flow, you must click the View path icon (
 ) in the Flow Exerciser toolbar to highlight message
paths on the flow.
- If you are using an integration service, or if your message flow
contains MQInput, HTTPInput, or SOAPInput nodes, click the Send
message icon (
 ) in the Flow Exerciser toolbar.
You can then use the Send Message dialog to
create an input message (or select an existing input message or recorded
message) and send it to the flow. The Send
message function is not available for flows in a REST
API.
) in the Flow Exerciser toolbar.
You can then use the Send Message dialog to
create an input message (or select an existing input message or recorded
message) and send it to the flow. The Send
message function is not available for flows in a REST
API.For more information, see the following topics:
After the messages are processed by the flow, the message
paths are automatically highlighted on the flow. In an integration
service, click the operation name in the Integration Service
Description page to see the message paths highlighted on
the subflow.

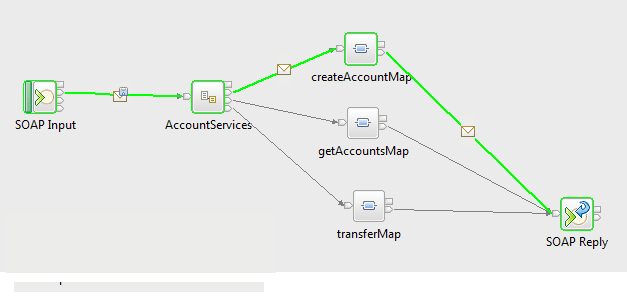
The diagram shows a flow where the message paths
are highlighted. At least one message passed through each
highlighted connection.
Note:
- The highlighted connections do not distinguish between the paths
that are taken by different messages. If you send
more than one message to the flow, you must inspect
each highlighted connection to see which messages passed through that
connection.
- If you send a single message to the flow and the message passes
through a connection multiple times, each time the
message passes through a connection, the logical
message tree is captured as a separate message instance.
- By default a maximum of 200 message instances are displayed in
the message flow, but you can change this value
in the preferences ().
- If the number of message instances that are captured exceeds the
number that is configured in the preferences, you
are prompted to choose whether to view the configured
number of recorded messages, or whether to view all the recorded messages:
- If you opt to view the configured maximum number of recorded messages,
you might not see whole sequences of messages.
- If you opt to view all the messages, there might be a performance
impact.
- Click a highlighted connection to view the data that passed
through the connection.
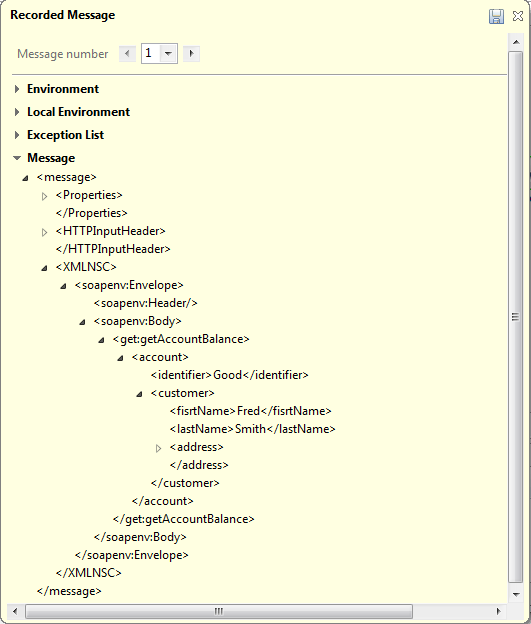
A
Recorded
Message dialog is displayed that shows the logical
message tree for each occasion that a message passed through
the connection, as shown in the following image.

If the message is too large
for the Recorded Message dialog, only part of the message
is displayed. To view the complete contents of the message, you can
right-click within the message in the Recorded
Message dialog, select Copy unformatted
message from the menu, and paste the message
into a text editor.
If more than one message was sent to the
message flow, or if a single message passed through a
connection multiple times, you can see the state of the
logical message tree for each message instance by selecting or clicking
through the message numbers in the dialog header.
- Optional: If you want to save a recorded message
for future use, complete the following steps:
- Click the highlighted connection between an input node
and the next node in the message flow (
 ).
). For an integration service, click the highlighted
connection between the binding and the service operation on the Integration
Service Description page.
- Click the Save icon (
 ) in the Recorded
Message dialog header.
 The Save
Input Message dialog opens.
- Enter a name to identify the recorded message and click
OK.
The recorded
message is saved and added to the list of recorded messages
that are available from the
Send Message dialog.
For information about recorded messages, see
Messages that you can use.
- To return the message flow that is in the message flow
editor to edit mode, click the Return flow to edit mode icon
(
 ).
). The
resource is still deployed on the integration server, but the recorded
messages are cleared from the message flow and you are able to edit
the message flow or integration service again.
 ) in the
  ) in the
  ) in the

 ).
). ) in the
  ).
).