Question & Answer
Question
Gathering this information before contacting IBM support will help you with the troubleshooting process and save time analyzing the data.
Answer
This technote describes what information you need to provide IBM support to troubleshoot a Maximo performance or stability issue.
If you have not compiled the General information, please see Collecting Data: Read first for Maximo Asset Management and include that information.
If you have not compiled the General information, please see Collecting Data: Read first for Maximo Asset Management and include that information.
Please answer the following regarding the Infrastructure:
- Did you make any changes to your infrastructures around the time the problem started. If yes,
- Hardware
- Did you add/remove any members to/from your cluster
- Did you move any software components to new hardware
- Have you introduced any new appliances to your network such as network accelerators
- Did you reconfigure or apply any software updates to any of the following Software? (If the answer is yes, please also describe the change including the old and new versions)
- Network Configuration such as DNS
- Cluster environment
- Load balancer
- Application server
- Database server
- Server Operating System
- Browser
- Have you recently increased the number of users accessing the system
Logging Configuration
For performance and stability problems, IBM recommends capturing up to 24 hours of logs so that application server trending can be done.
Enable Maximo performance-related System Properties
The information provided by the application debug properties is critical to the resolution process. The three properties listed in the following setup do not impact performance and provide valuable information about the system. We recommended these properties be left on at all times to help with root cause analysis if there is an event.
Enabling and modifying logging
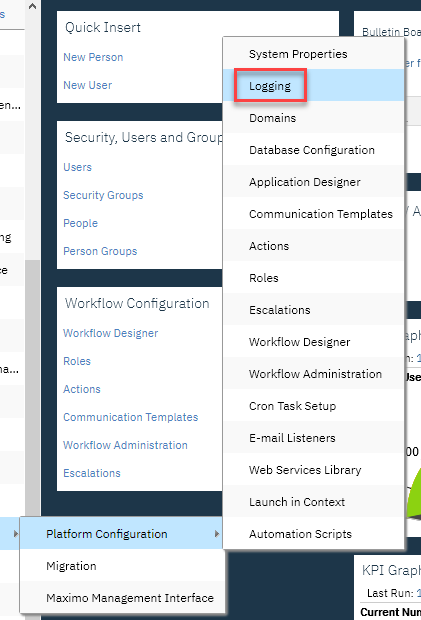
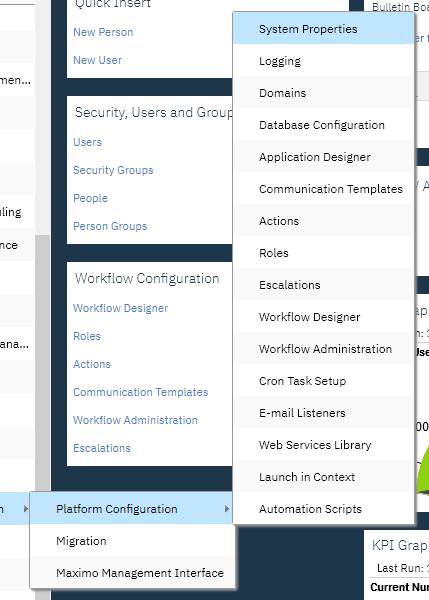
On the left navigation bar, hover over System Configuration. Select Platform Configuration, then Logging.
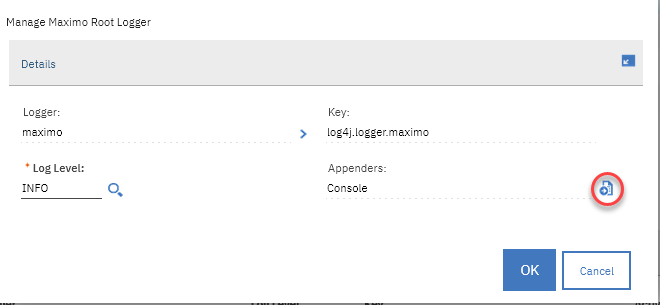
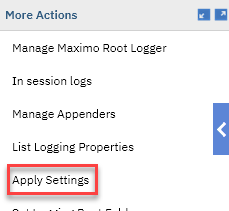
Under More Actions on the left navigation bar, click Manage Maximo Root Logger. Make sure Log Level is set to INFO. Add Rolling to the Appenders.
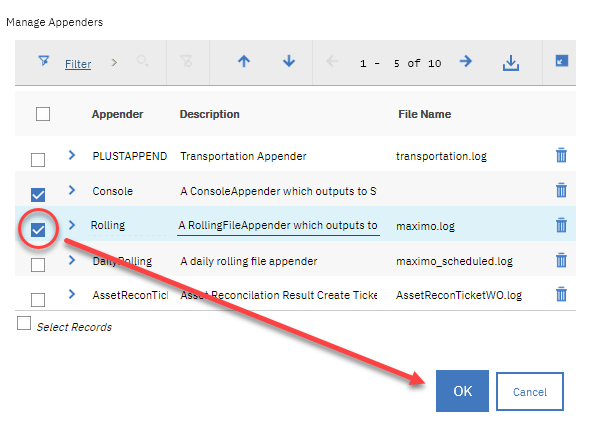
Under More Actions on the left navigation bar, click Manage Appenders.
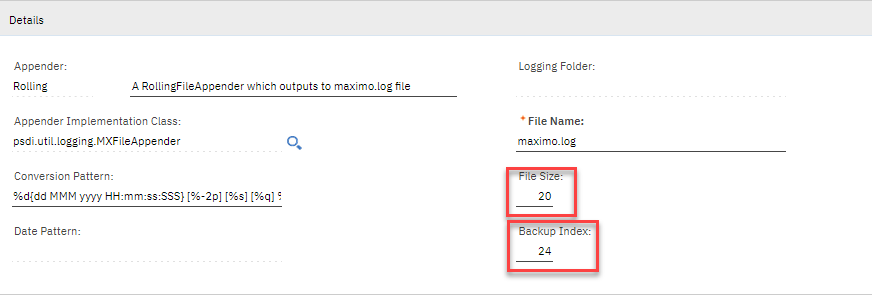
Set the Rolling Appender to a file size of 20 and backup index of 24.
Click Apply Settings.
Click Apply Settings.
Change performance-related properties in System Properties
On the left navigation bar, hover over System Configuration. Select Platform Configuration, then System Properties.
Note: If you changes any values of the three below, after changing the value and saving, select the property and click Live Refresh on the left navigation bar.
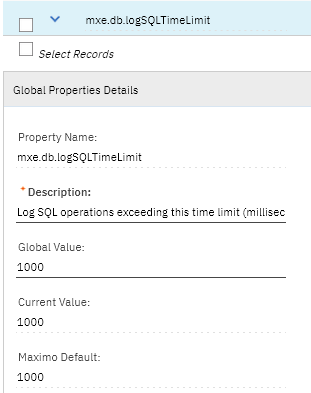
Filter for mxe.db.logSQLTimeLimit. Confirm the Current Value is 1000.
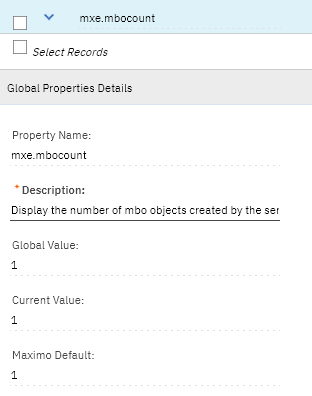
Filter for mxe.mbocount. Confirm the Current Value is 1.
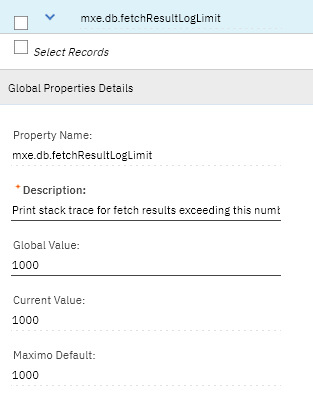
Filter for mxe.db.fetchResultLogLimit. Confirm the Current Value is 200.
Changes to make in WebSphere Application Server
- Turn on verbose garbage collection logging:
- Stop the Maximo Application Server
- Default location: Servers > WebSphere application servers > Application servers > MXServer
- Once the server has stopped, click the name of the server. On the right, under Server Infrastructure expand Java and Process Management
- Click Process Definition. Under Additional Properties, click Java Virtual Machine
- Check the box next to Verbose garbage collection
- Click Apply and Save directly to the master configuration.
- Move or delete all WebSphere and Maximo logs. See Clearing WebSphere temporary file caches for Maximo Asset Management
- Generate Heap Dumps. See Generating Heap Dumps - Maximo Application Server hosted on WebSphere
- Generate Java cores. See Collecting Java dumps and core files using the administrative console
- In WebSphere console, on the left side, expand Troubleshooting.
- Click Java dumps and cores
- Select the server(s) to collect dumps from
- Click Java Core, System Dump, or Heap Dump to produce the specified file.
- When requested, click Java Core every two minutes or so to generate four or five javacore files.
- Gather Maximo session data. Using a SQL utility, connect to Maximo database, run the following query and post it to the case:
select * from maxsession
Additional information
Network Topology Information
- Are some clients connected through Citrix or Terminal Server
- User geographic locations in relation to the application server
- Total Concurrent users
- Is a firewall employed between the client and Maximo server
- Is a proxy/reverse proxy server is employed between the client and Maximo server. If yes, describe
- Is network compression (Riverbed, Cisco, Juniper, etc) enabled?
- Does the environment use Clustering & Load Balancing
- If load balancing:
- Using a hardware or software load balancer (describe)
- Type of load balancing (round-robin, weight based, random, etc.)
- Using IBM HTTP Server with plug-in?
- How many IBM HTTP Servers?
Execute the following command from a slow performing client:
At an administrative command prompt enter the following (substitute the actual server name for the {app_server_name} value:
Version and Platform Information
Ping {app_server_Name} –n 100 >clientping.txttracert {app_server_name} >clienttrace.txtVersion and Platform Information
- From Maximo login:
- Log in to Maximo.
- Select Help>System Information
- Select the text from the window and paste into a text document (please do not take a screen capture. Transcribing information from a picture will introduce errors).
- If you cannot log in to Maximo:
- On the administrative workstation where you installed the product, start a command line prompt.
- Navigate to <maximo_home>\maximo\application\maximo (by default, Windows: C:\IBM\SMP\maximo\application\maximo, Linux: /opt/IBM/SMP/maximo/applications/maximo)
- Run version.bat >versioninfo.txt (Windows) ./version.sh >versioninfo.txt (Linux)
** Post the resulting system information text document, or copy and paste the results into the case.
[{"Line of Business":{"code":"LOB59","label":"Sustainability Software"},"Business Unit":{"code":"BU059","label":"IBM Software w\/o TPS"},"Product":{"code":"SSLKT6","label":"IBM Maximo Asset Management"},"ARM Category":[{"code":"a8m50000000CbOcAAK","label":"General->Maximo Base"},{"code":"a8m50000000CbPQAA0","label":"Performance"}],"Platform":[{"code":"PF002","label":"AIX"},{"code":"PF016","label":"Linux"},{"code":"PF027","label":"Solaris"},{"code":"PF033","label":"Windows"}],"Version":"7.5.0;7.6.0;7.6.1"}]
Was this topic helpful?
Document Information
Modified date:
18 May 2021
UID
swg21313341